“With great power, comes great responsibility” – Benjamin Parker
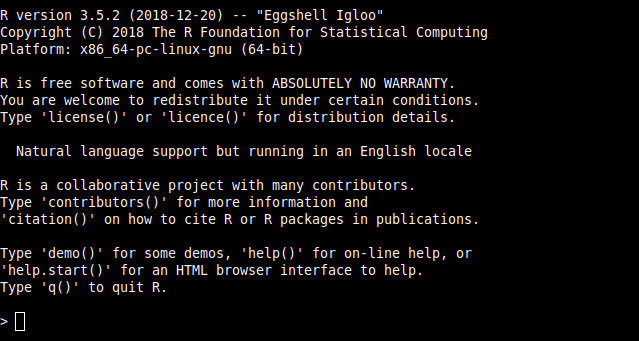
The second episode of our Into the Weeds podcast arc is about how computing advances of the late 1970s and early 1980s were critical to the development of paleolimnology. The increased availability of computational power prompted rapid improvements in statistical techniques and software. Many of the programs used in paleolimnology today are able to trace their history back to this time period. We also spend some time reflecting on how the command line interface (CLI) and DIY approach to programming of the UNIX/DOS era, that seemed to be in decline during the late-1990s and early-2000s (at least from our perspective), has returned with a vengeance through the proliferation of R-based statistical tools.
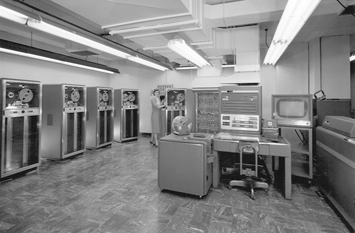
The history of computing within paleolimnology is closely tied to the history of multivariate statistical techniques. Some of the statistical approaches paleolimnologists use today are relatively old. For example, principal component analysis (PCA) and correspondence analysis (CA) were invented/proposed in the early 1900s and 1930s respectively. The complex calculations used in multivariate analyses became much less onerous as mainframe computers became available to universities in the 1970s and allowed the development of specialized software.
Prior to the 1980s paleolimnology was largely qualitative, with some quantitative approaches limited to comparing ratios and indices for individual taxa. A major change occurred during the late 1970s with the development of detrended correspondence analysis (DCA) and its implementation in the Fortran program DECORANA (A DOS version of DECORANA is freely available, along with an early version of the hierarchical cluster analysis program TWINSPAN).
As personal computers became increasingly widespread in the 1980s, the complex multivariate datasets available in paleolimnology had considerable appeal to statisticians. Development of calibration set and transfer function techniques occurred rapidly, along with the emergence of programs designed to implement these techniques (e.g. CANOCO), as well as software to simplify the production of stratigraphic diagrams (e.g. Tilia).
In the wake of the graphical user interface (GUI) popularized by Windows 95, a fresh wave of software arrived for paleolimnologists. Slide projectors were quickly retired as PowerPoint became the standard presentation format. A wide variety of statistical programs emerged (e.g. SPSS), as well as highly specialized tools for analyzing and visualizing paleolimnological data (e.g. C2).
Today, the dominance of Windows has decreased from its peak, and within one lab, students may be bouncing between Windows, macOS and/or GNU/Linux machines (plus iOS and Android).In this multiplatform era, the highly extensible R programming language has emerged as an essential tool for the paleolimnology toolbox. Many of the older programs already mentioned have been implemented within R packages (e.g. the DCA function within the package ‘vegan’ is called ‘decorana’, the functionality of C2 is provided by the package ‘rioja’, and many plots you will see in scientific papers today were generated using the ‘ggplot2’ package). The return to a CLI interface is a little ironic given how alien the command prompt seemed to so many graduate students just a few years ago.